
Deploying Elastic Security in a Homelab
Elastic Security is a modern, open-source, Security Information and Event Management (SIEM) solution from Elastic. Elastic started with two products, Elasticsearch and Kibana. These two tools are merely a search and analytics engine and visualizer. Elastic Security is built on these two tools. Elastic Security uses the Elastic Agent to report data through a fleet server. This data is ingested by Elasticsearch which processes the data and allows Kibana to visualize this data in things like dashboards and timelines. In this article, I will discuss my deployment of Elastic Security in a small home lab environment.
The Environment:
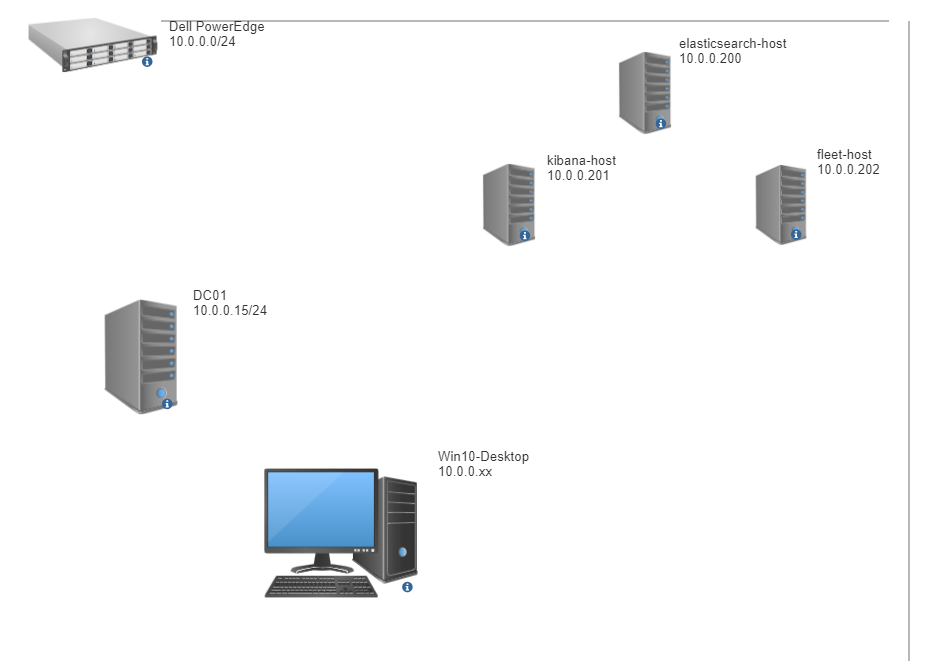
This will be deployed in a very small lab consisting of one Domain Controller, a single Windows 10 endpoint, and 3 Ubuntu Server 22.04 hosts to run the three components that will make up Elastic Security. This will be deployed on a bare metal Dell PowerEdge in a segmented 10.0.0.0/24 VLAN. Elastic usually recommends deploying through their own cloud solution, however, there are also options to deploy using Kubernetes, Docker, both, or bare metal. I will be hosting each part of the Elastic Security solution (ElasticSearch, Kibana, and the Fleet Server) on it’s own host. This will require some configuration.
Setting Up Our Hosts:
As mentioned, there are many options to deploy Elastic Security from Kubernetes, to Elastic’s own cloud, to docker containers on baremetal. However, having tried all of those, the simplest is to deploy Elastic Security on baremetal using their own documentation. That is the method I chose to use.
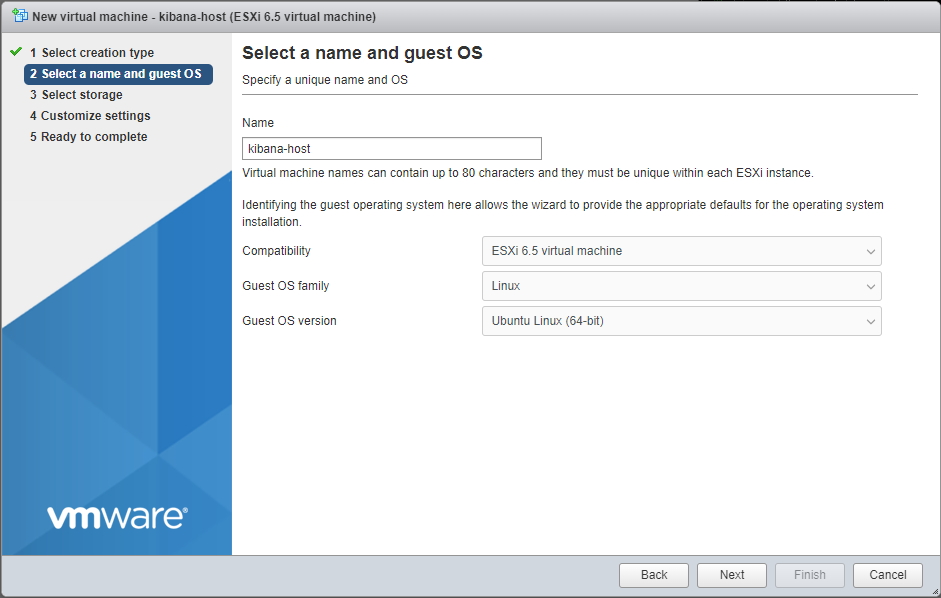
First I setup my three Ubuntu Server 22.04 hosts with static IP addresses in my homelab’s VLAN, 10.0.0.x/24. These will be configured based on the network map above.
These hosts all have 3 CPUs, 8192MB of memory, and 40GB of storage.
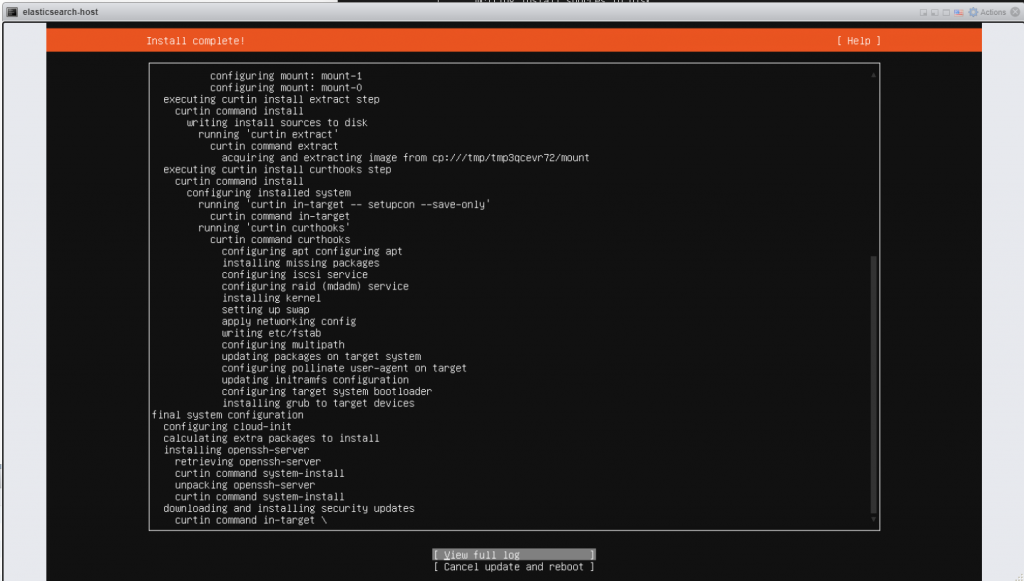
Deploying Elasticsearch:
I configured and setup ElasticSearch based on their documentation here:
https://www.elastic.co/guide/en/elasticsearch/reference/8.8/deb.html#deb-enable-indices
After I was done configuring ElasticSearch, I copied the supplied token needed to register Kibana. Then I edited the network.host value in /etc/elasticsearch/elasticsearch.yml to reflect the IP of the host it was deployed on. (10.0.0.200).
Deploying Kibana:
Kibana is the visualizer I will work with when investigating and performing blue team operations in my homelab. I followed configuration documentation here:
https://www.elastic.co/guide/en/kibana/8.8/deb.html#deb-layout
In order to interface with ElasticSearch and Kibana, I needed to point my Kibana instance to an available IPv4 address. I configured server.host in /etc/kibana/kibana.yml to be the IPv4 of the host Kibana is ran on. (10.0.0.201).
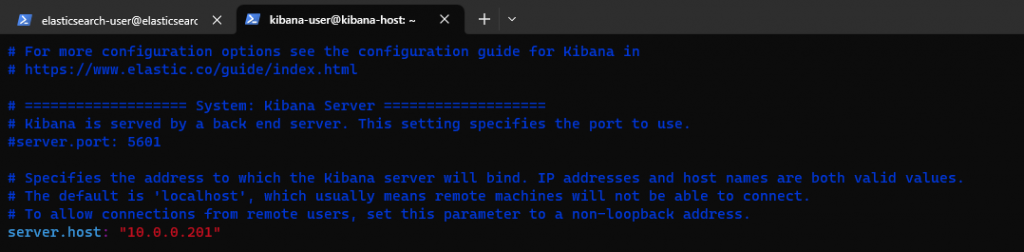
Next up, I had to navigate to this IP address over port 5601 and input the token copied from earlier. This is the preferred way to initialize communication between ElasticSearch and Kibana. Verification is then handled through a security pin.
**Note**
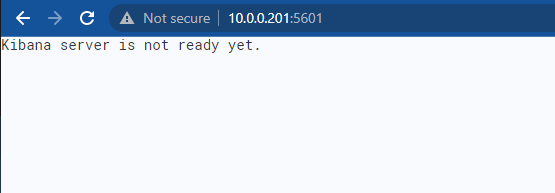
If you attempt to configure communication between ElasticSearch , and Kibana via the .yml files, you are likely to mess something up, resulting in the error “Kibana server is not ready yet.”
After I registered Kibana, I was prompted to enter a 6 digit pin. This can be found by running sudo systemctl status kibana.service
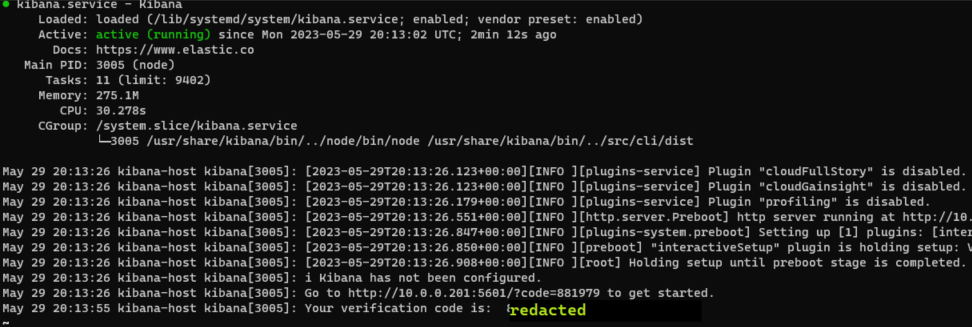
After entering this security code, I logged in with the default username elastic and the password generated upon starting ElasticSearch for the first time. This was generated at the same time the token to register Kibana was generated.
Adding a Fleet Server:
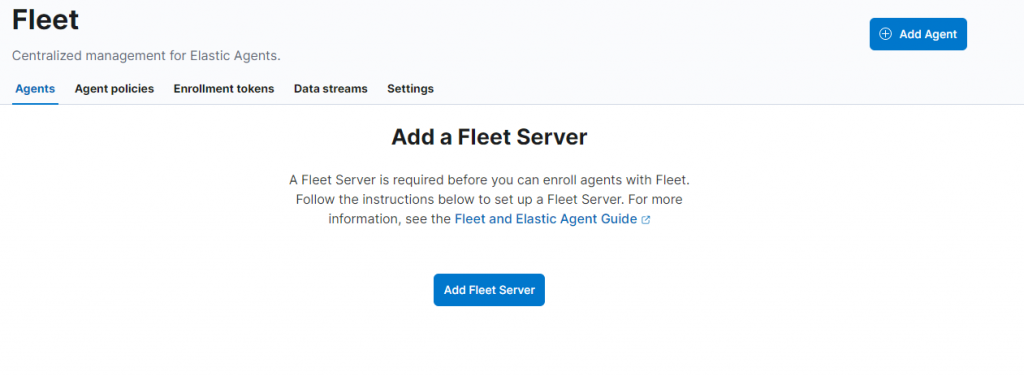
In order for data to be ingested into ElasticSearch, the Fleet Server needs to be configured to gather data from Elastic Agents that live on hosts. The Fleet Server will be managed by its own Ubuntu host at 10.0.0.202. I first added this host as a fleet agent and was able to obtain download instructions for configuring the fleet agent.
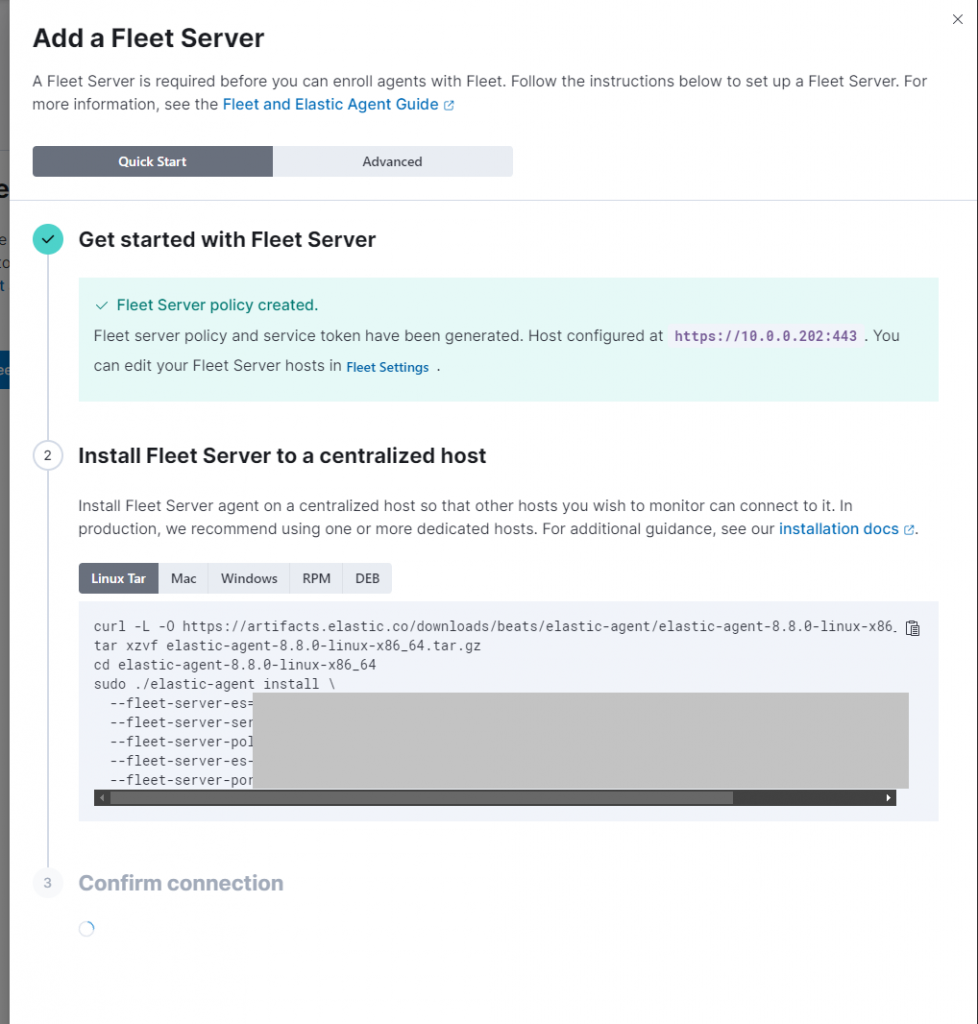
Once you add a fleet server, you’ll have to add a name and URL. I used the hostname of the host the fleet server agent will be installed on, and the IP of the machine as the URL. (fleet / hxxps[:]//10.0.0.202[:]443)
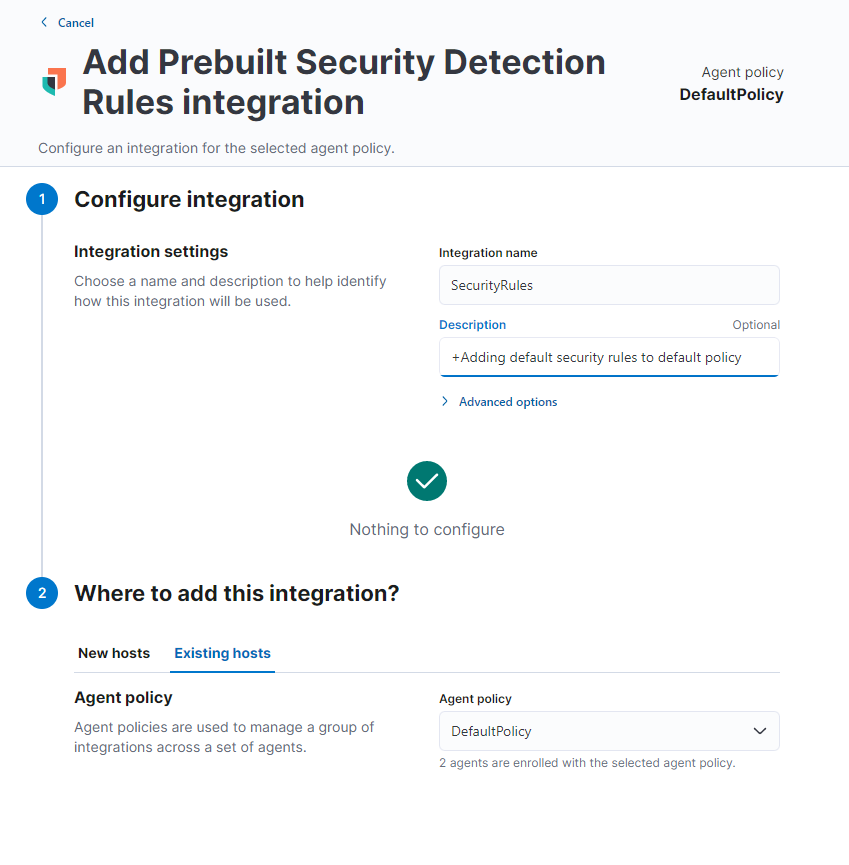
After adding this Fleet Server, a default fleet policy should be created. In addition to this policy, I created a new policy called “Default Policy” that I can assign to the rest of my hosts. There are two integrations for this policy that are necessary to report alerts. These are the Elastic Defend integration and Default Rule Set. These integrations can be found under “Management” -> “Integrations”
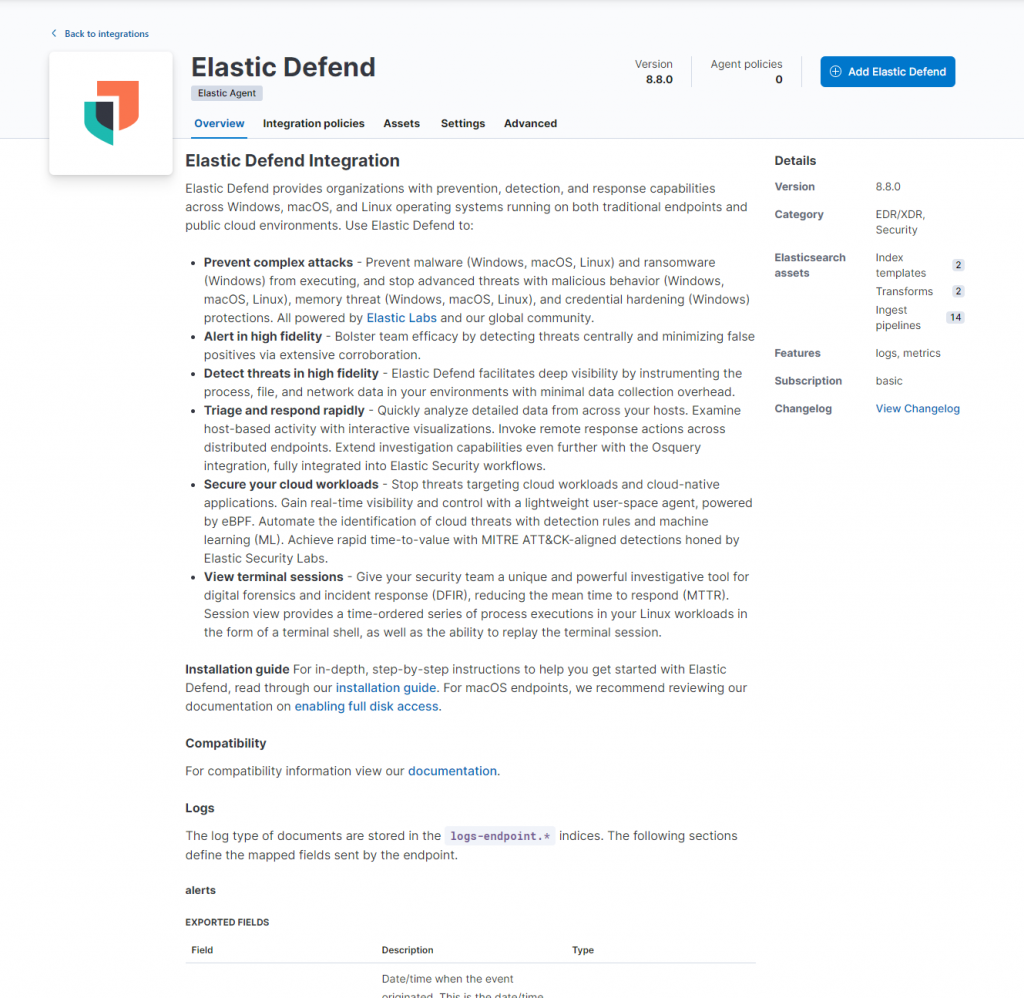
I added both of these to my Default Policy.
After adding the two integrations, I can now add the Elastic Agent to my Domain Controller and host. This was accomplished by navigating to “fleet” -> “add agent” and selecting the appropriate policy.
For Windows devices, I had a prompt like the one below. I had to change the default port from 443 to 8220. Check which port your fleet server is listening on if you’re having errors connecting.
$ProgressPreference = 'SilentlyContinue'
Invoke-WebRequest -Uri https://artifacts.elastic.co/downloads/beats/elastic-agent/elastic-agent-8.8.0-windows-x86_64.zip -OutFile elastic-agent-8.8.0-windows-x86_64.zip
Expand-Archive .\elastic-agent-8.8.0-windows-x86_64.zip -DestinationPath .
cd elastic-agent-8.8.0-windows-x86_64
.\elastic-agent.exe install --url=https://10.0.0.202:443 --enrollment-token=[token_here]
I also had to add the –insecure flag due to using a self-signed cert. The install commands that worked were as follows:
$ProgressPreference = 'SilentlyContinue'
Invoke-WebRequest -Uri https://artifacts.elastic.co/downloads/beats/elastic-agent/elastic-agent-8.8.0-windows-x86_64.zip -OutFile elastic-agent-8.8.0-windows-x86_64.zip
Expand-Archive .\elastic-agent-8.8.0-windows-x86_64.zip -DestinationPath .
cd elastic-agent-8.8.0-windows-x86_64
.\elastic-agent.exe install --url=https://10.0.0.202:8220 --enrollment-token=[token_here] --insecure
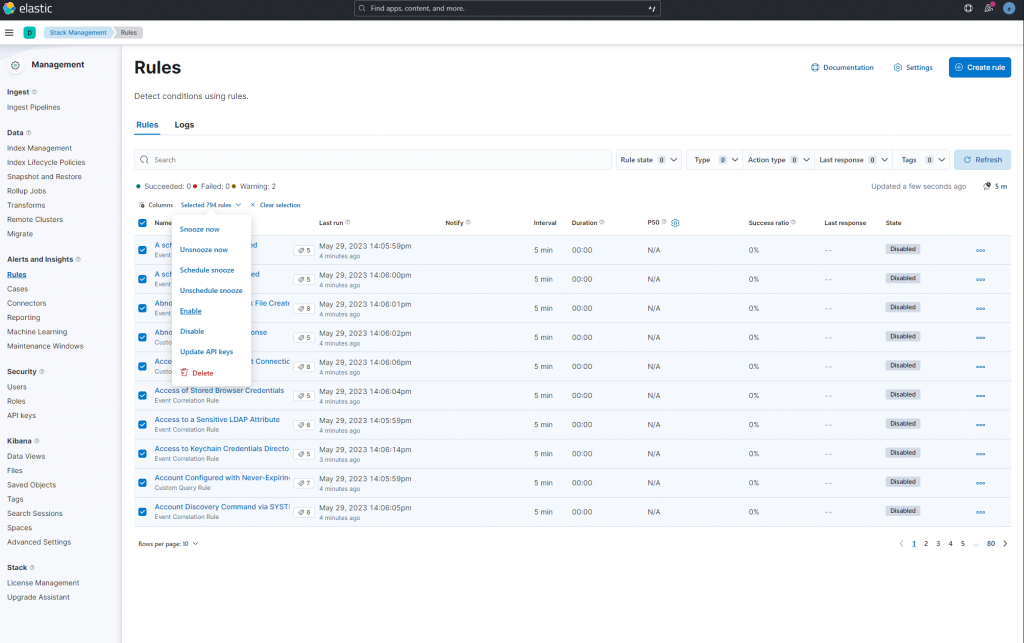
Now that we have agents deployed and events being ingested via the Fleet Server, we can enable our rules and start generating noise. Navigate to “Stack Management” -> “rules” select all, and “Enable”
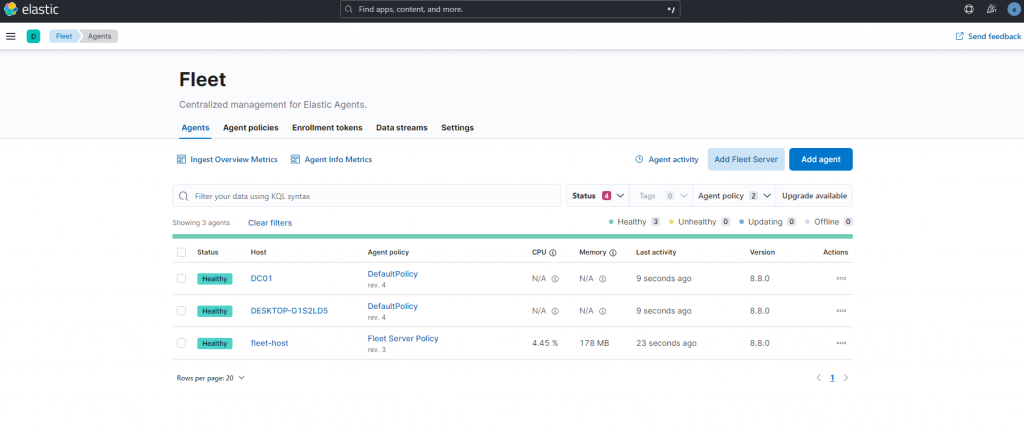
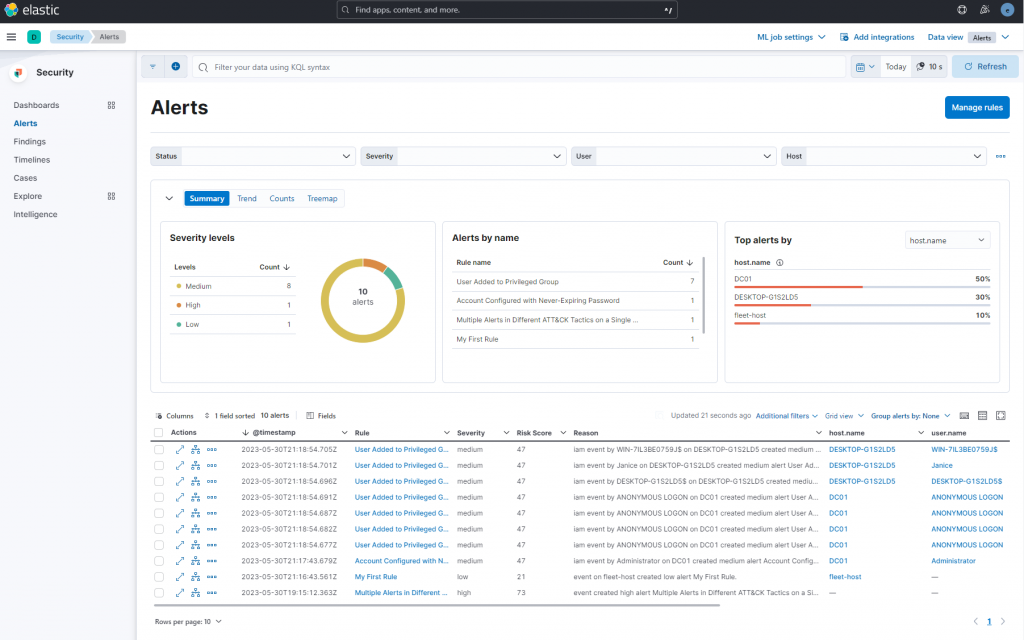
Visibility can be confirmed a variety of ways: through checking agent health on the “Agents” section of the “Fleet” page under “Management,” checking the “Discover” tab under “Analytics,” or going to “Security” -> “Explore” -> “Hosts.” While this may ensure we can see the hosts with a healthy agent, it does not confirm proper rule reporting. To do this, I had to perform suspicious actions on each machine. The “first alert” was generated by my fleet host, thus I could confirm reporting. Next, I configured a user with a never expiring password on my DC, and installing just about anything is sure to create some alarms on a Windows host.
With all hosts configured and checking in, I have completed the installation and initial configuration of Elastic Security in my home lab. I will continue to use it for blue teaming and security engineer work. Cheers!